Have you ever seen tiny balls falling through a triangle of pegs and collecting in bins at the bottom, forming a perfect bell-shaped curve? That fascinating device is called a Galton Board — also known as a Quincunx or Bean Machine. Invented by Sir Francis Galton in the 19th century, this clever machine offers a simple yet powerful way to understand one of the most important concepts in mathematics — probability and the normal distribution.
What Is a Galton Board?
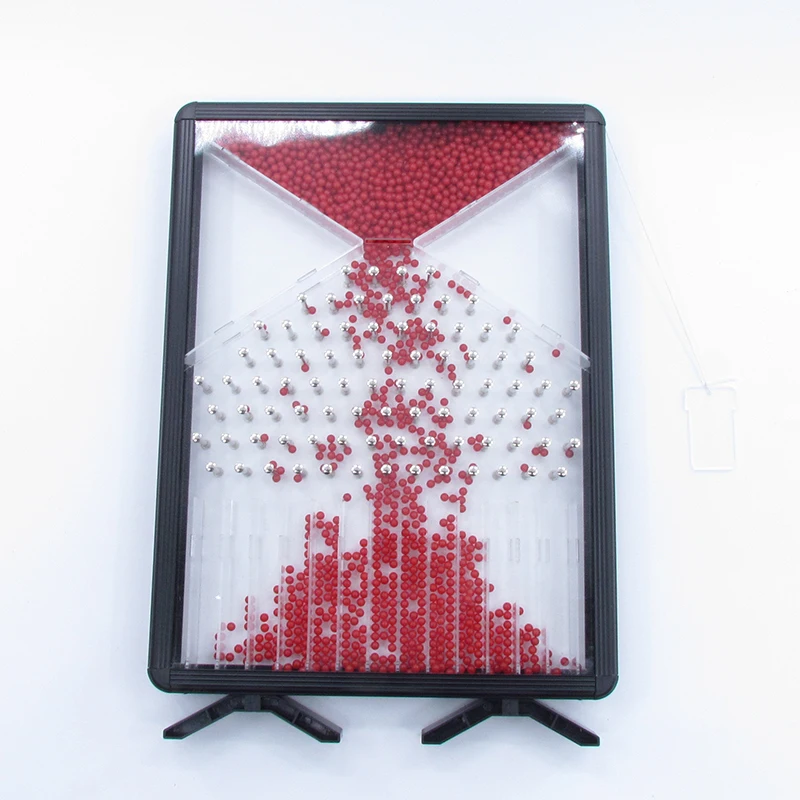
A Galton Board is a vertical board filled with rows of small pegs arranged in a triangular pattern. When small balls (or beads) are dropped from the top, they bounce randomly left or right as they hit each peg, finally collecting in bins at the bottom.
Over time, as more and more balls fall, they form a distinctive bell-shaped pattern, known as the Normal Distribution Curve or Gaussian Curve. This visual representation shows how random events often lead to predictable outcomes.
How the Galton Board Works?
Let’s break down what happens step by step:
1. Ball Release
A ball is released from the top of the board.
2. Random Bounces
As the ball travels downward, it strikes several pegs. Each time it hits a peg, it has an equal chance (50/50) to fall left or right.
3. Final Bin Placement
After many bounces, the ball finally lands in one of the bins at the bottom.
4. Pattern Formation
When hundreds or thousands of balls are dropped, most of them collect near the center bins, while fewer reach the outer bins. This forms a bell-shaped curve — demonstrating how random individual events can lead to predictable collective results.
Understanding Probability
Probability is the measure of how likely an event is to happen. It is expressed as a number between 0 and 1, where:
- 0 means the event will not happen.
- 1 means the event will definitely happen.
For example, if you flip a fair coin, the probability of getting heads is 0.5 (or 50%), and the probability of getting tails is also 0.5.
Now, think of the Galton Board — each time a ball hits a peg, it has a 50% chance to go left and a 50% chance to go right. Although every single movement is random, when you repeat the process many times, a clear pattern emerges.
This is the power of probability — even when individual outcomes are uncertain, collective results follow predictable patterns.
Normal Distribution Explained
The Normal Distribution, also called the Bell Curve, is a probability distribution that shows how values are spread around the mean (average).
In a normal distribution:
- Most values cluster around the mean (center).
- Fewer values occur as you move further away from the mean.
- The shape of the graph looks like a bell — highest in the center and tapering off on both sides.
Example of Normal Distribution
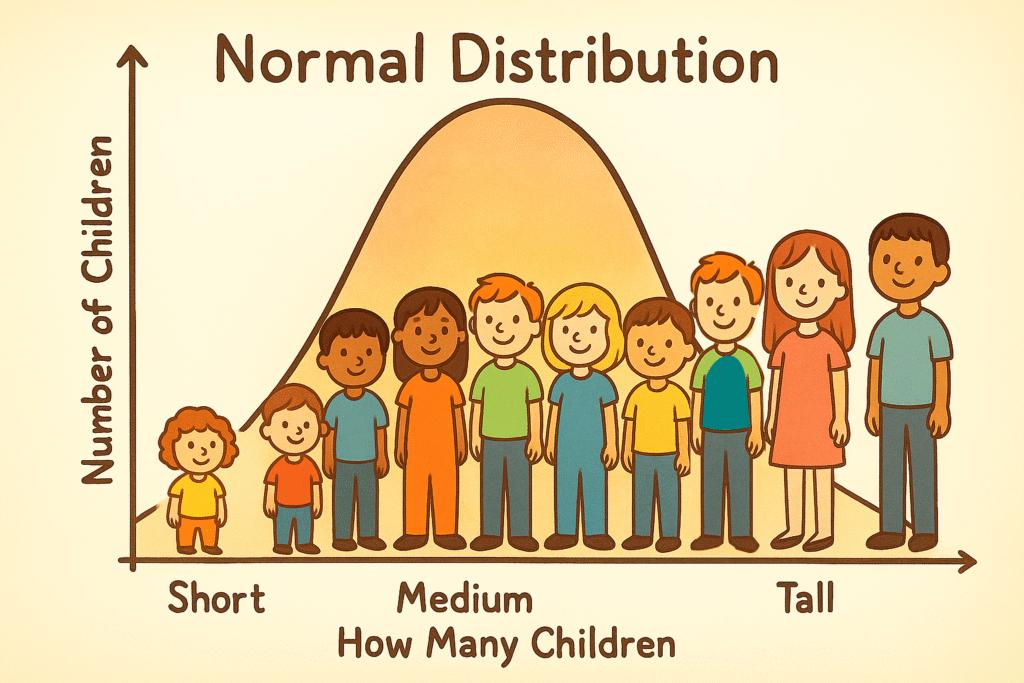
Imagine you are measuring the height of 1,000 children in a school.
- Most children will have an average height (say around 150 cm).
- Some will be a little shorter, and some a little taller.
- Very few will be extremely short or extremely tall.
If you plot these heights on a graph, it will form a bell-shaped curve — the Normal Distribution.

In short, extremely short or extremely tall children will be rare and most number of children will lie around average height.
The Galton Board demonstrates the same concept visually. Each ball’s path represents a random event, and when all paths are combined, they naturally form the bell curve — just like the distribution of students’ heights.
Connecting Galton Board with Probability and Normal Distribution
- Each peg on the Galton Board is like a probability event — left or right.
- After many pegs, the total number of left or right turns follows a binomial distribution.
- When thousands of balls are dropped, the binomial distribution begins to resemble the normal distribution — showing how random processes lead to stable, predictable outcomes.
This connection makes the Galton Board one of the best visual tools to understand probability theory and statistical behavior in the real world.
If you are interested to buy your own Galton Board, click here: https://s.click.aliexpress.com/e/_c2wzmXrz
To know more about Galton Board, you can watch the video here:


Salam, qiymətinizi bilmək istədim.
Salam, if you are interested to buy the Galton board in that article, you can place the order by clicking on affiliate link given the article. I have also copied below.:
https://s.click.aliexpress.com/e/_c2wzmXrz
Thanks.