
Interactive Math tools
Practice math by moving, testing, plotting, and exploring.
These interactive math tools help young learners see ideas in action. Use them to explore coordinates, geometry, functions, counting patterns, factorials, permutations, combinations, and other visual math topics.
Math tool library
Explore every Math tool on Genius Littles.
The tools below should be loaded automatically from WordPress. When you publish a new interactive tool and assign it to the Math Tools category, it will appear here without editing this page manually.
-
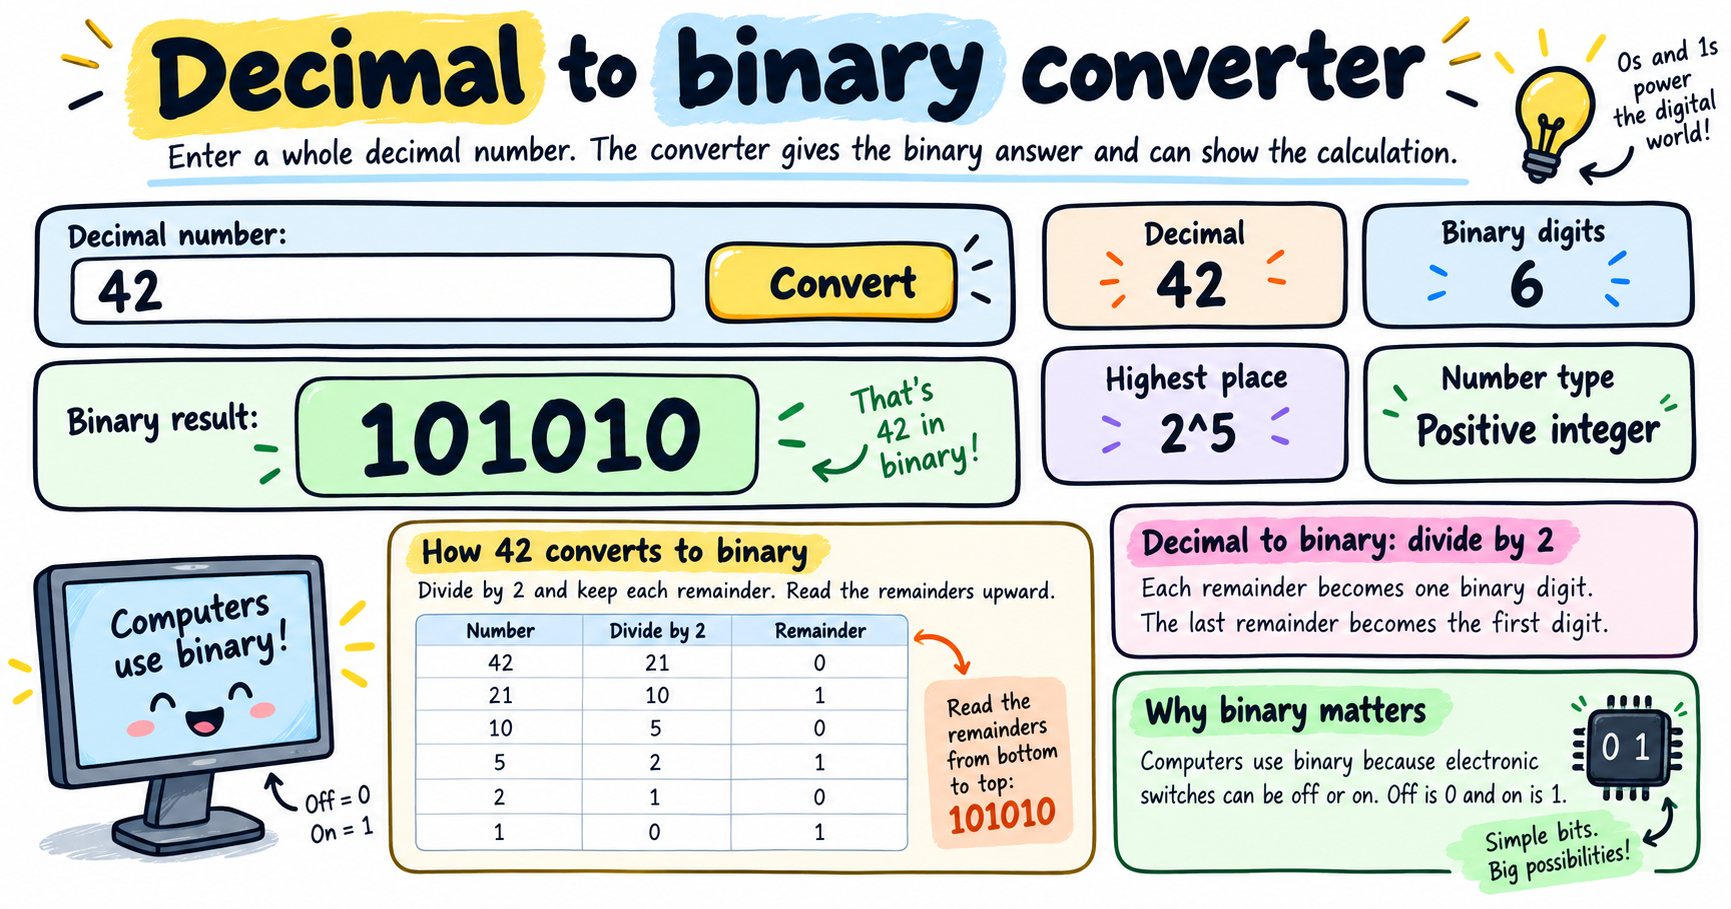
Use this decimal to binary converter to convert base 10 numbers into binary and see the step-by-step division method. You can also convert between binary, decimal, octal, hexadecimal, and other bases. How to use the decimal to binary converter 1 Enter a decimal number Type a whole base 10 number, such as 42, 64, 100,…
-
Use this interactive logic gates simulator to test binary inputs, compare outputs, and see the matching boolean expression and truth table for each gate. How to use the logic gates simulator 1 Choose a gate Select AND, OR, NOT, NAND, NOR, XOR, or XNOR. The circuit rule changes instantly. 2 Switch inputs Turn input A…
-
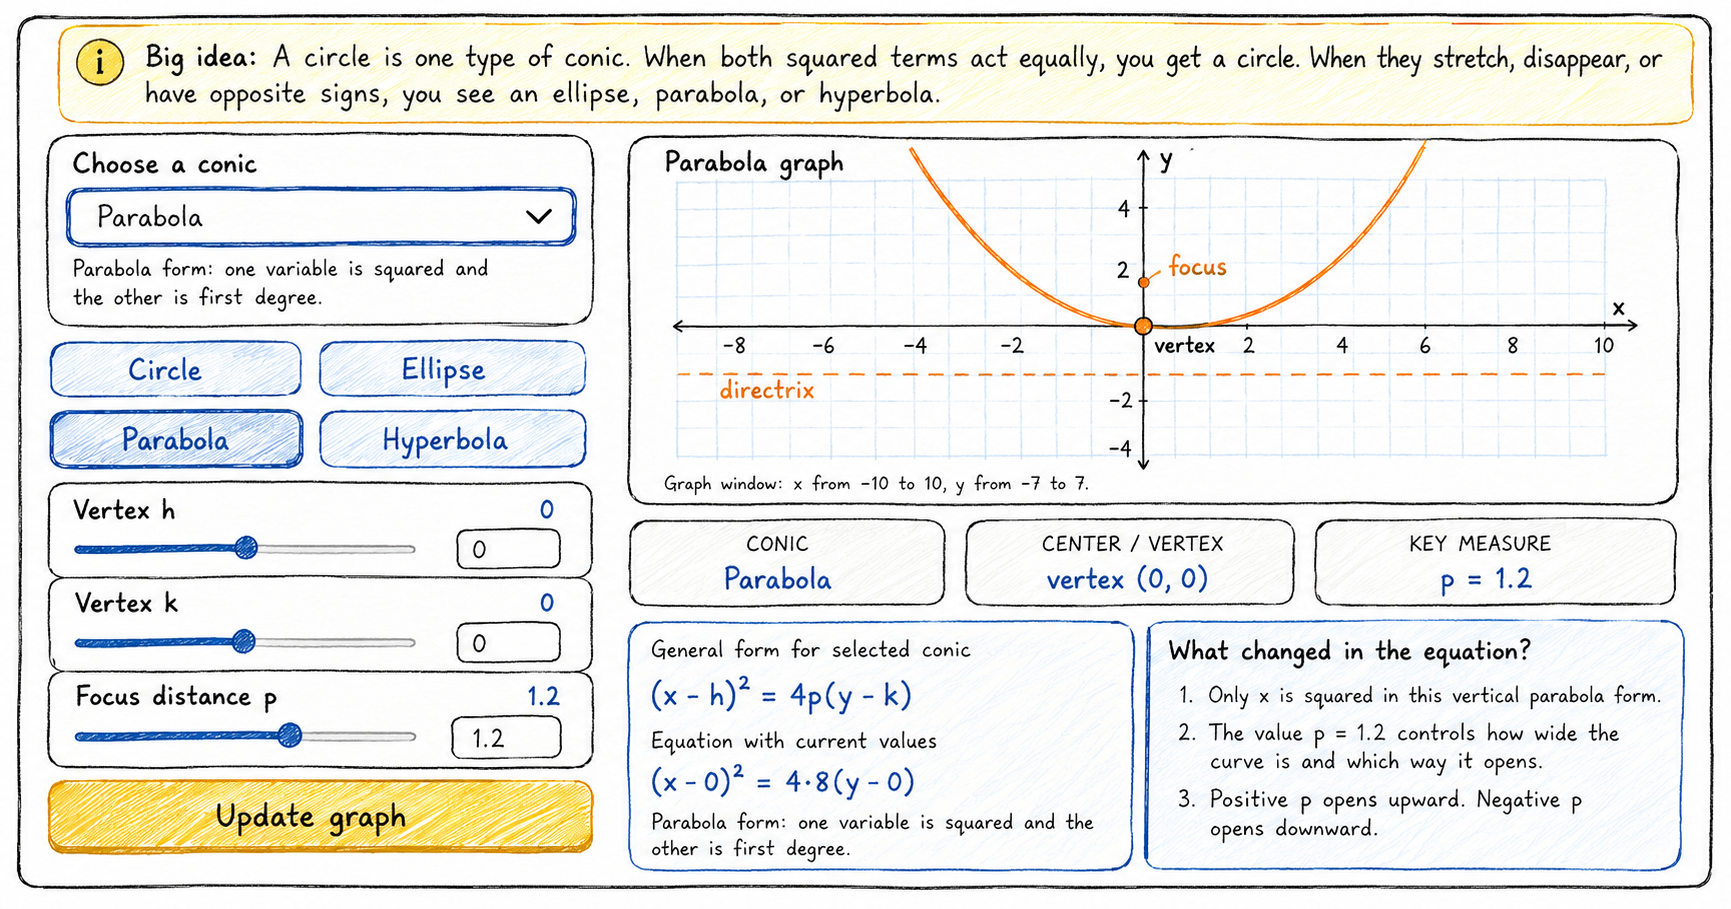
Use this interactive conic section tool to explore circle equations, then compare them with an ellipse, parabola, and hyperbola. Move the sliders to see how the general equation and graph change together. How to use the circle equations and conic section explorer 1 Start with a circle Choose Circle to see how center and radius…
-
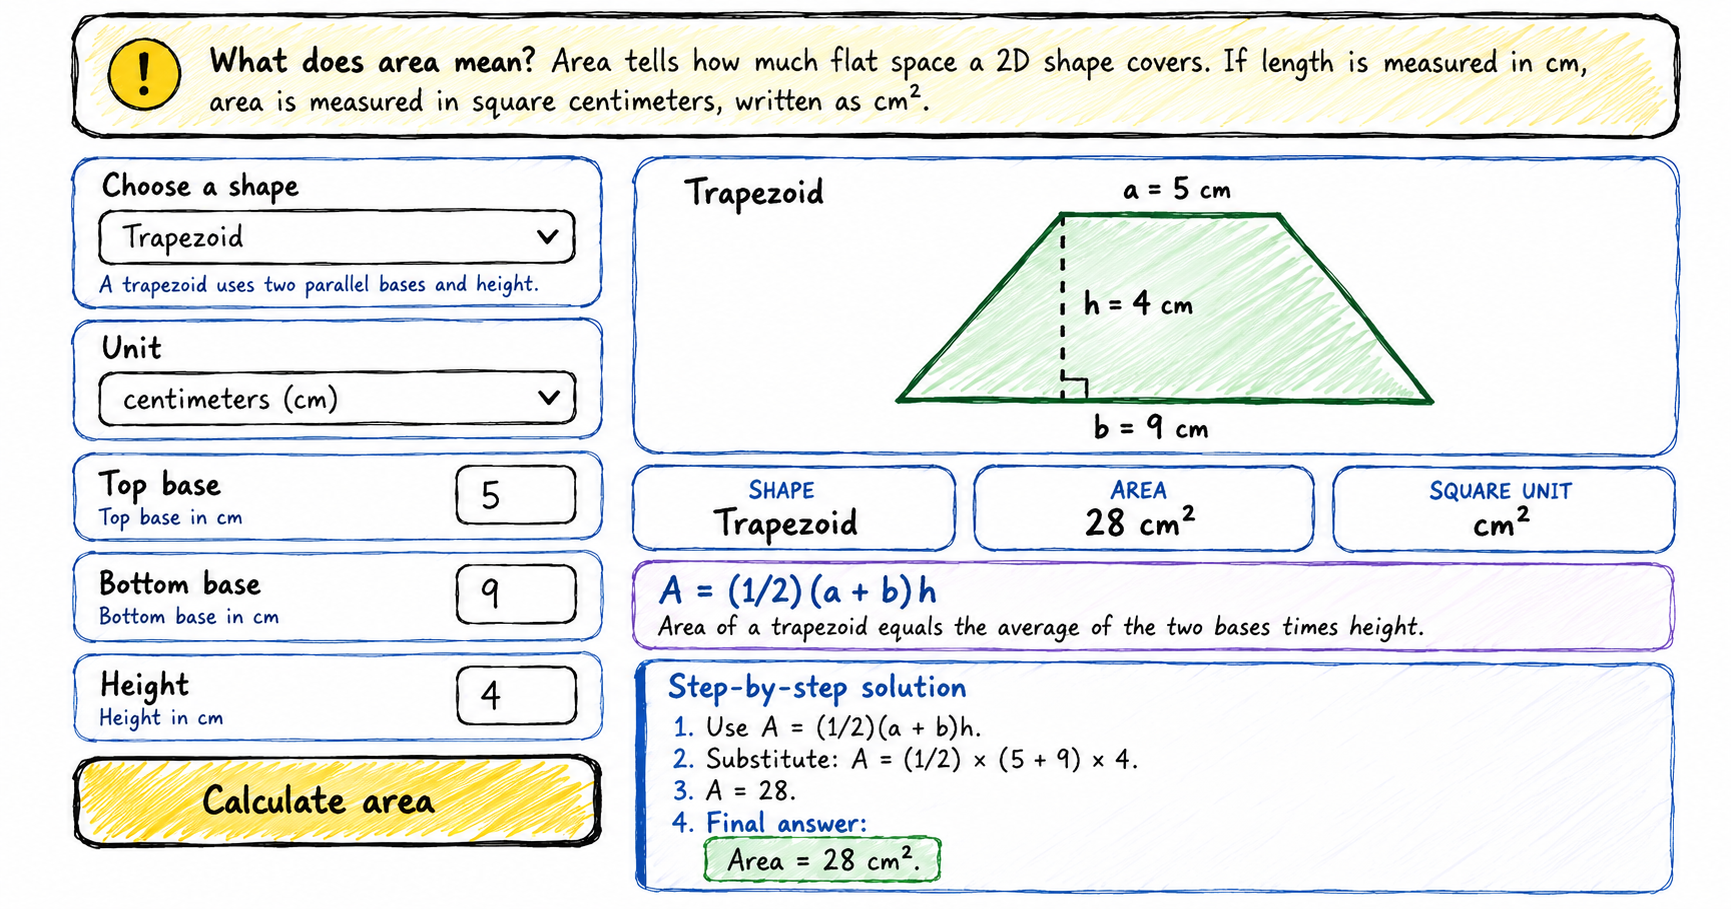
Use this multi-shape area calculator to find the area of a square, rectangle, triangle, circle, semicircle, parallelogram, trapezoid, or ellipse. Each answer includes a diagram, formula, square units, and step-by-step calculation. How to use the area calculator 1 Choose a shape Select square, rectangle, triangle, circle, semicircle, parallelogram, trapezoid, or ellipse. 2 Enter measurements The…
-
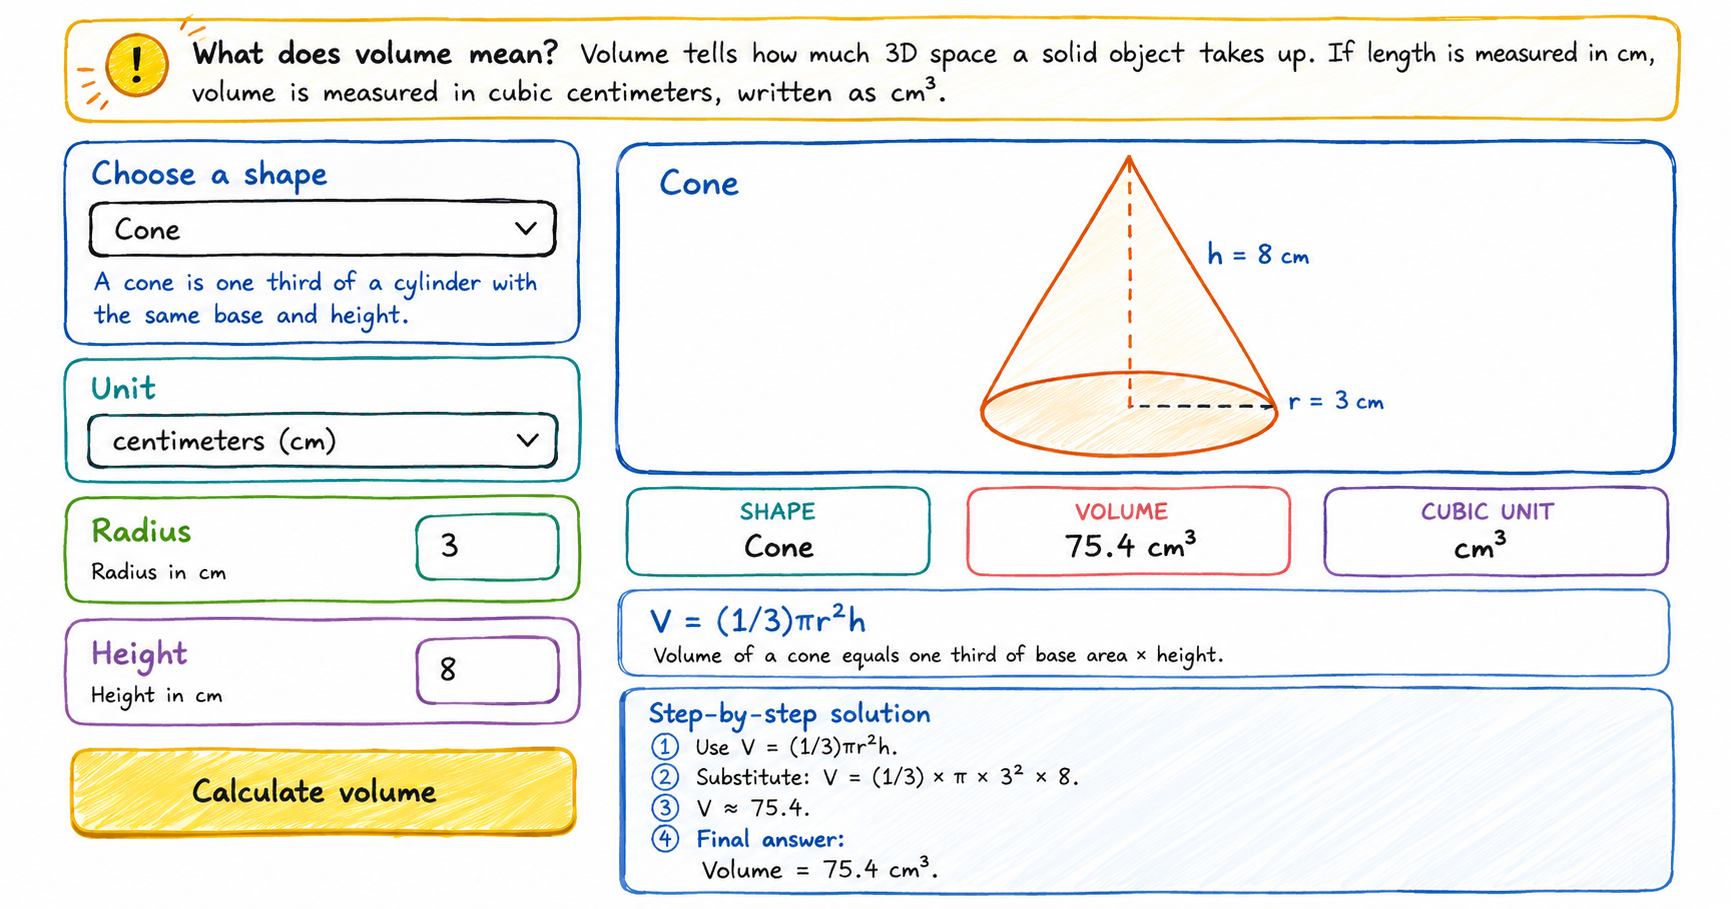
Use this multi-shape volume calculator to find the volume of a cube, cuboid, cylinder, cone, sphere, or hemisphere. Each answer includes a diagram, formula, cubic units, and step-by-step calculation. How to use the volume calculator 1 Choose a shape Select cube, cuboid, cylinder, cone, sphere, or hemisphere. 2 Enter measurements The input fields change automatically…
-
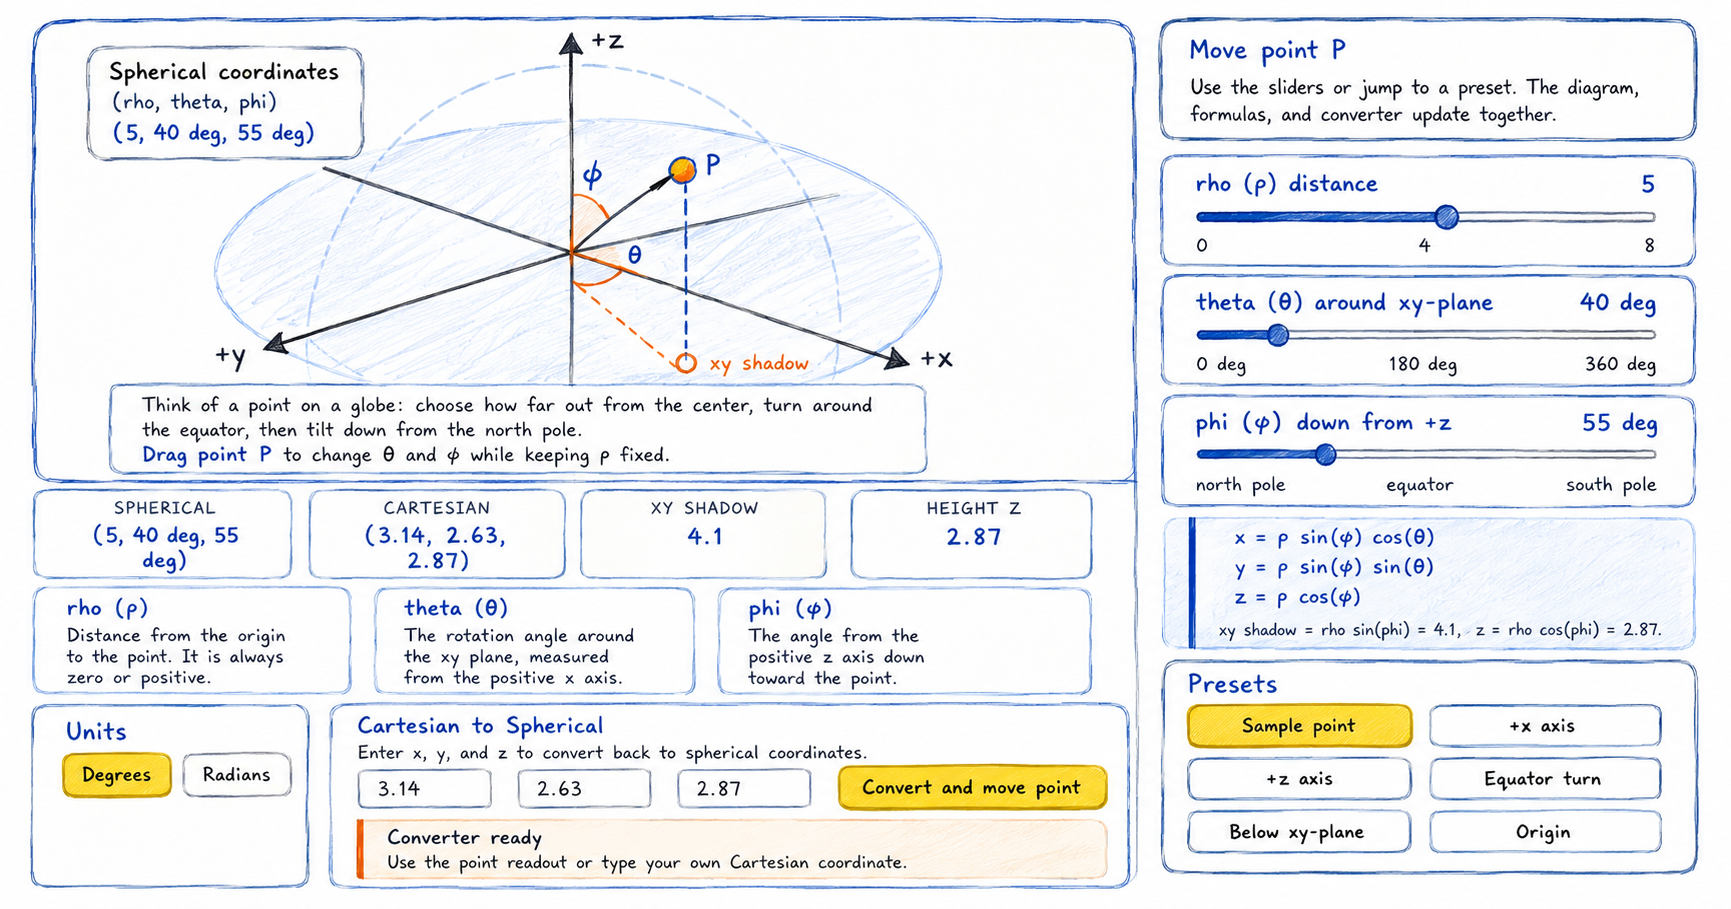
Explore spherical coordinates with an interactive 3D-style diagram. Drag point P, compare spherical and Cartesian coordinates, and learn how rho (ρ), theta (θ), and phi (φ) describe a point in space. How to use the spherical coordinates interactive tool This activity extends the idea of polar coordinates into 3D space. Instead of only radius and…
-
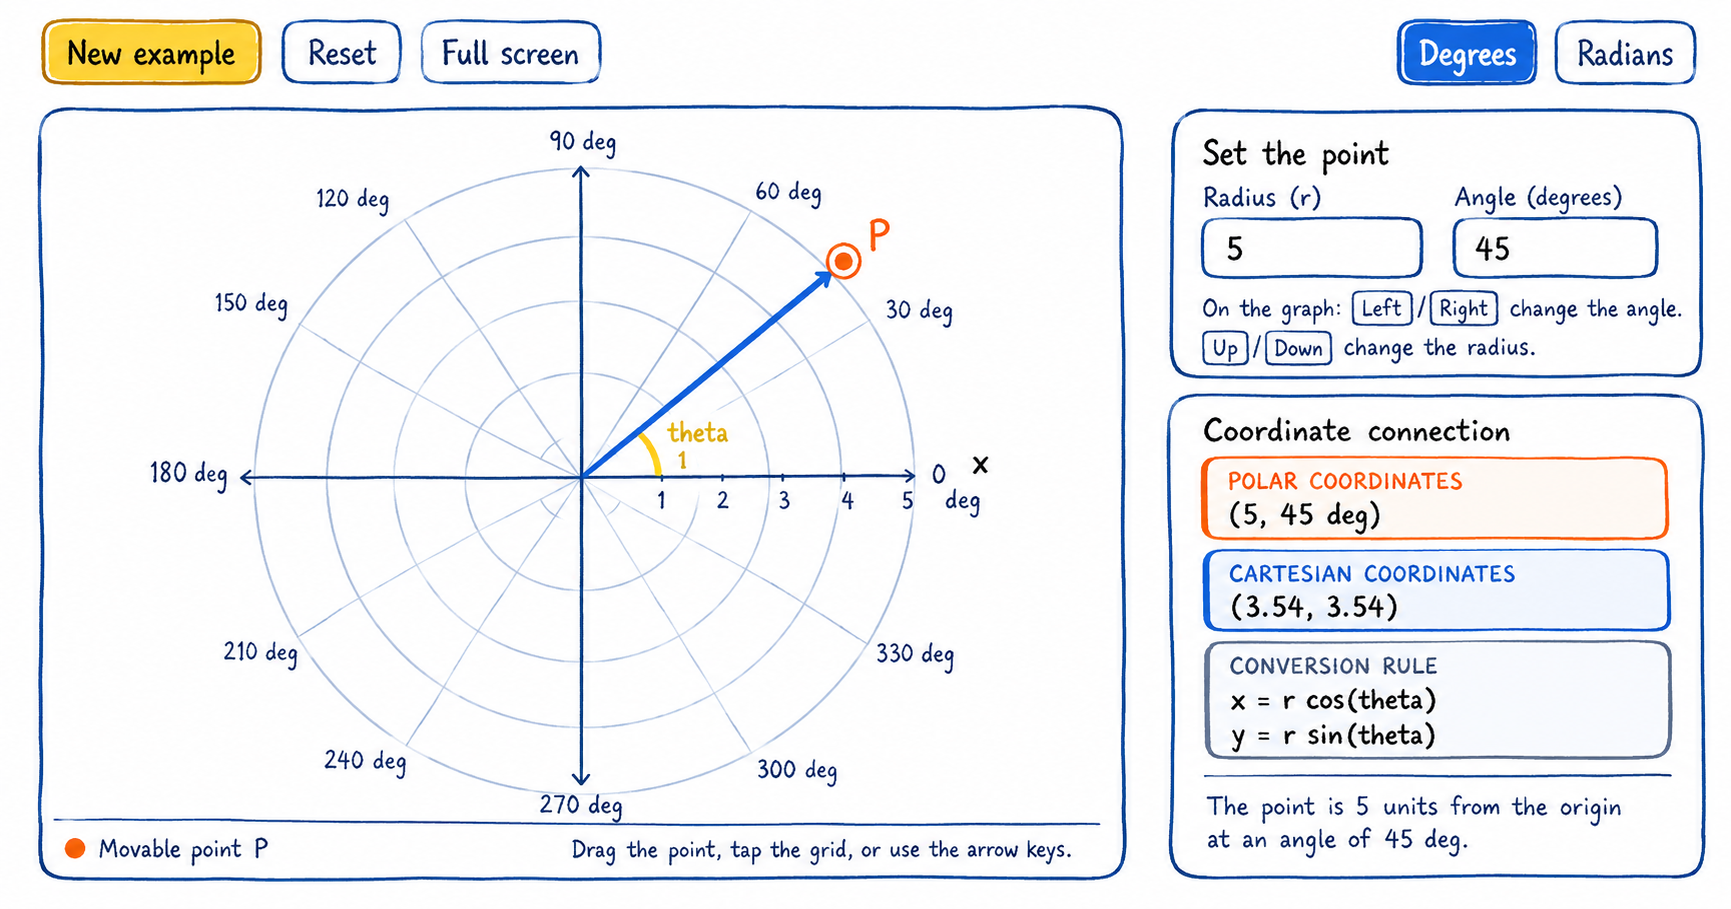
Explore polar coordinates by moving a point around a circular grid. See how radius and angle describe its position, connect polar coordinates to x- and y-coordinates, and practice conversions with worked steps. How to use the polar coordinate interactive tool The activity combines a movable point with a coordinate converter. Start on the graph, then…
-
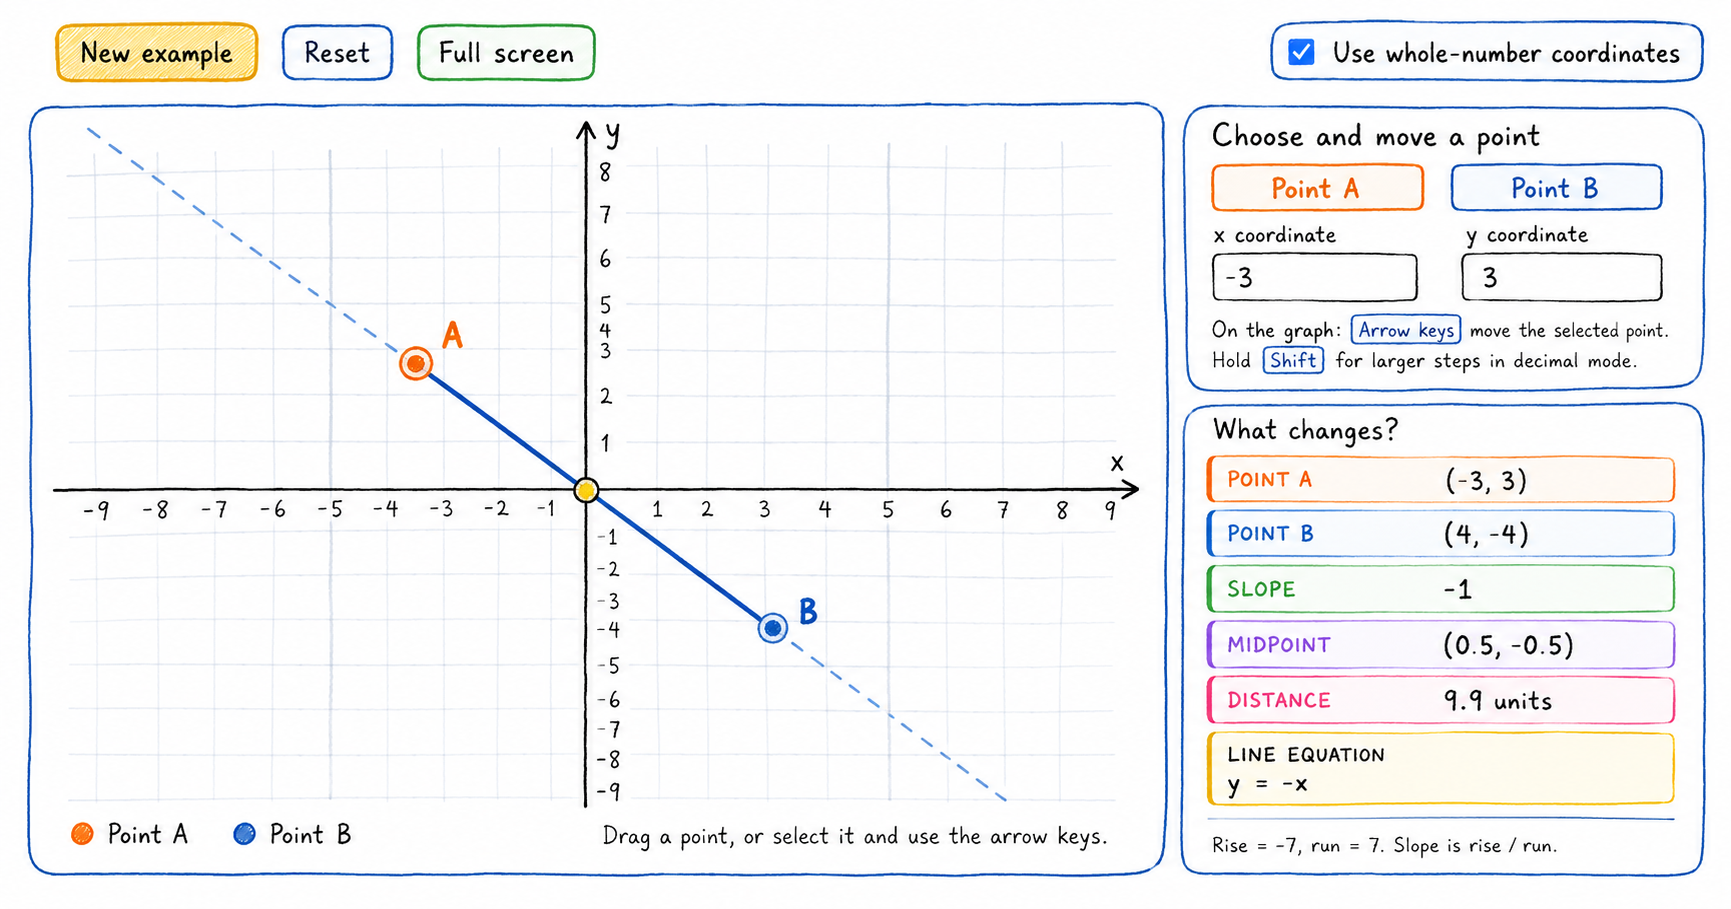
Explore the Cartesian coordinate plane by moving two points on the graph. The interactive tool calculates the slope, midpoint, distance, and equation of the line in real time, helping learners connect each formula to a visual result. How to use the Cartesian coordinate tool Start with points A and B on the coordinate plane. Every…
-
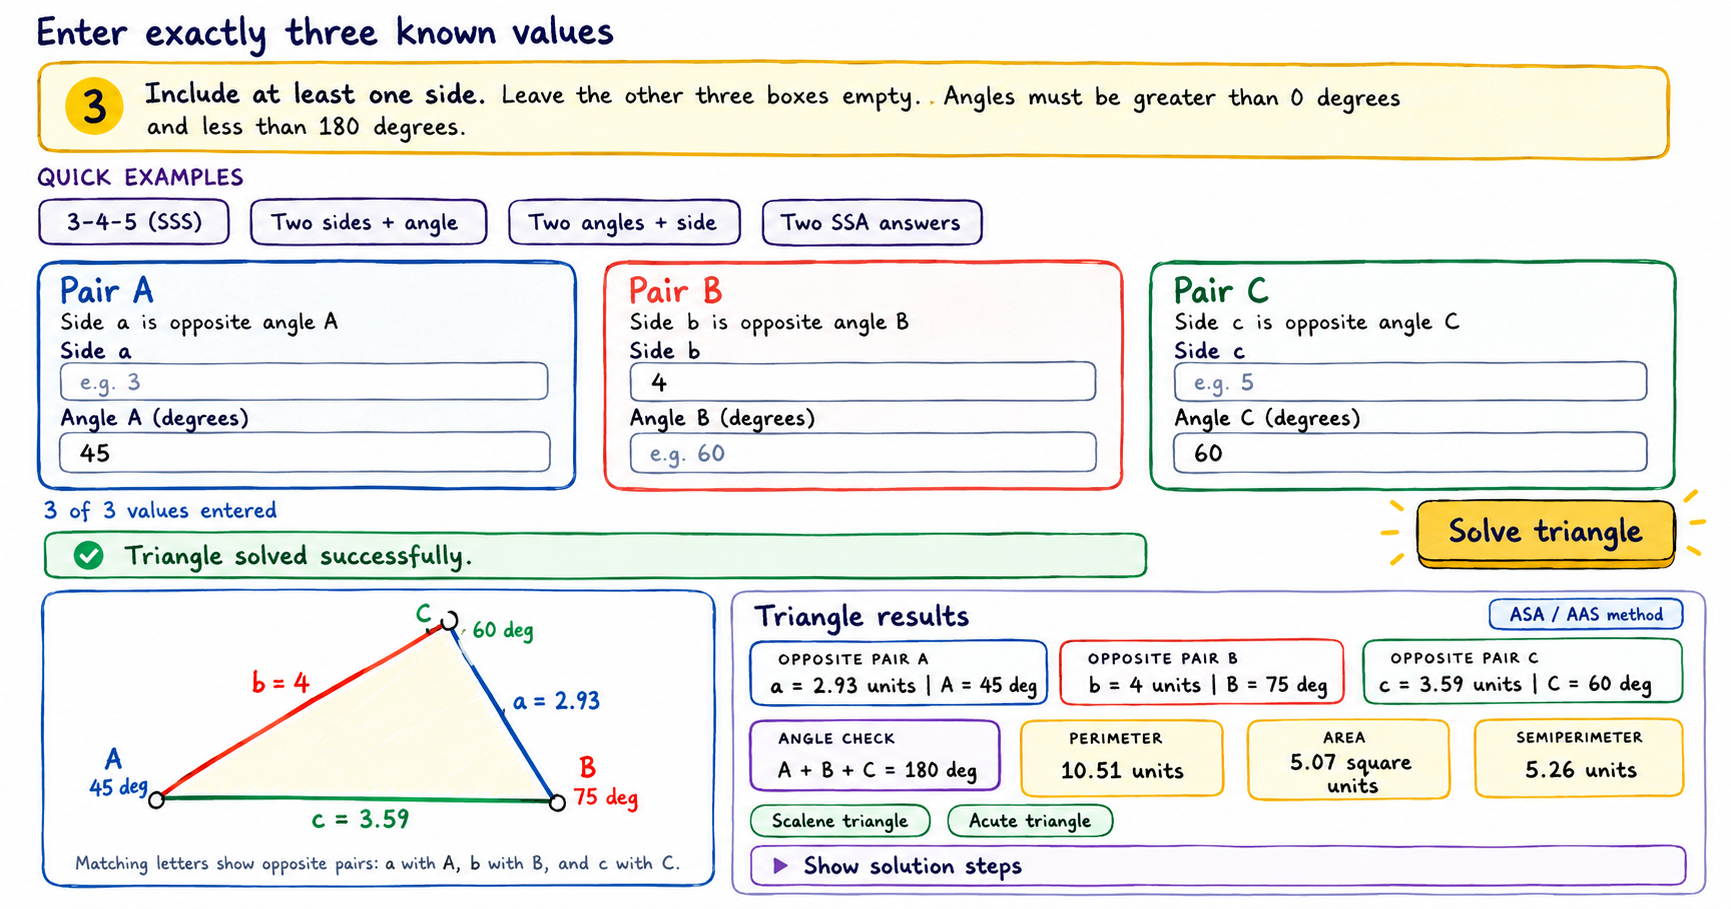
Use this interactive triangle calculator to enter three known measurements, solve the missing sides and angles, view a proportional diagram, and follow the calculation method. How to use the triangle calculator Enter exactly three known measurements and leave the other three boxes empty. At least one known measurement must be a side. 1 Match opposite…