Multi-Shape Volume Calculator

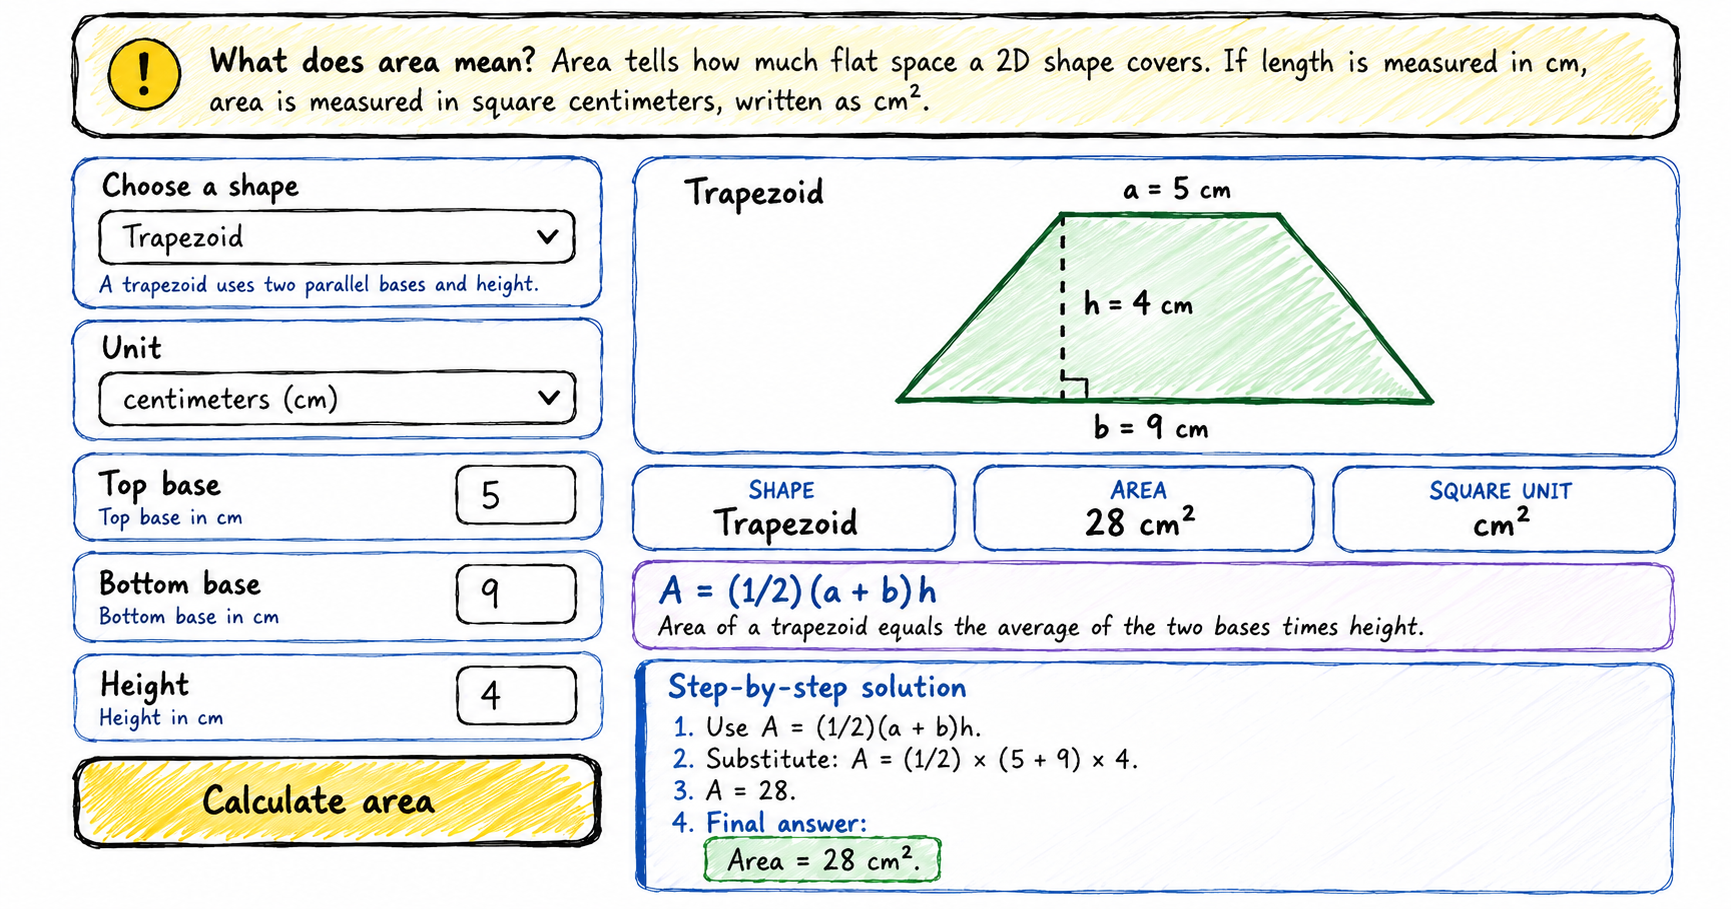
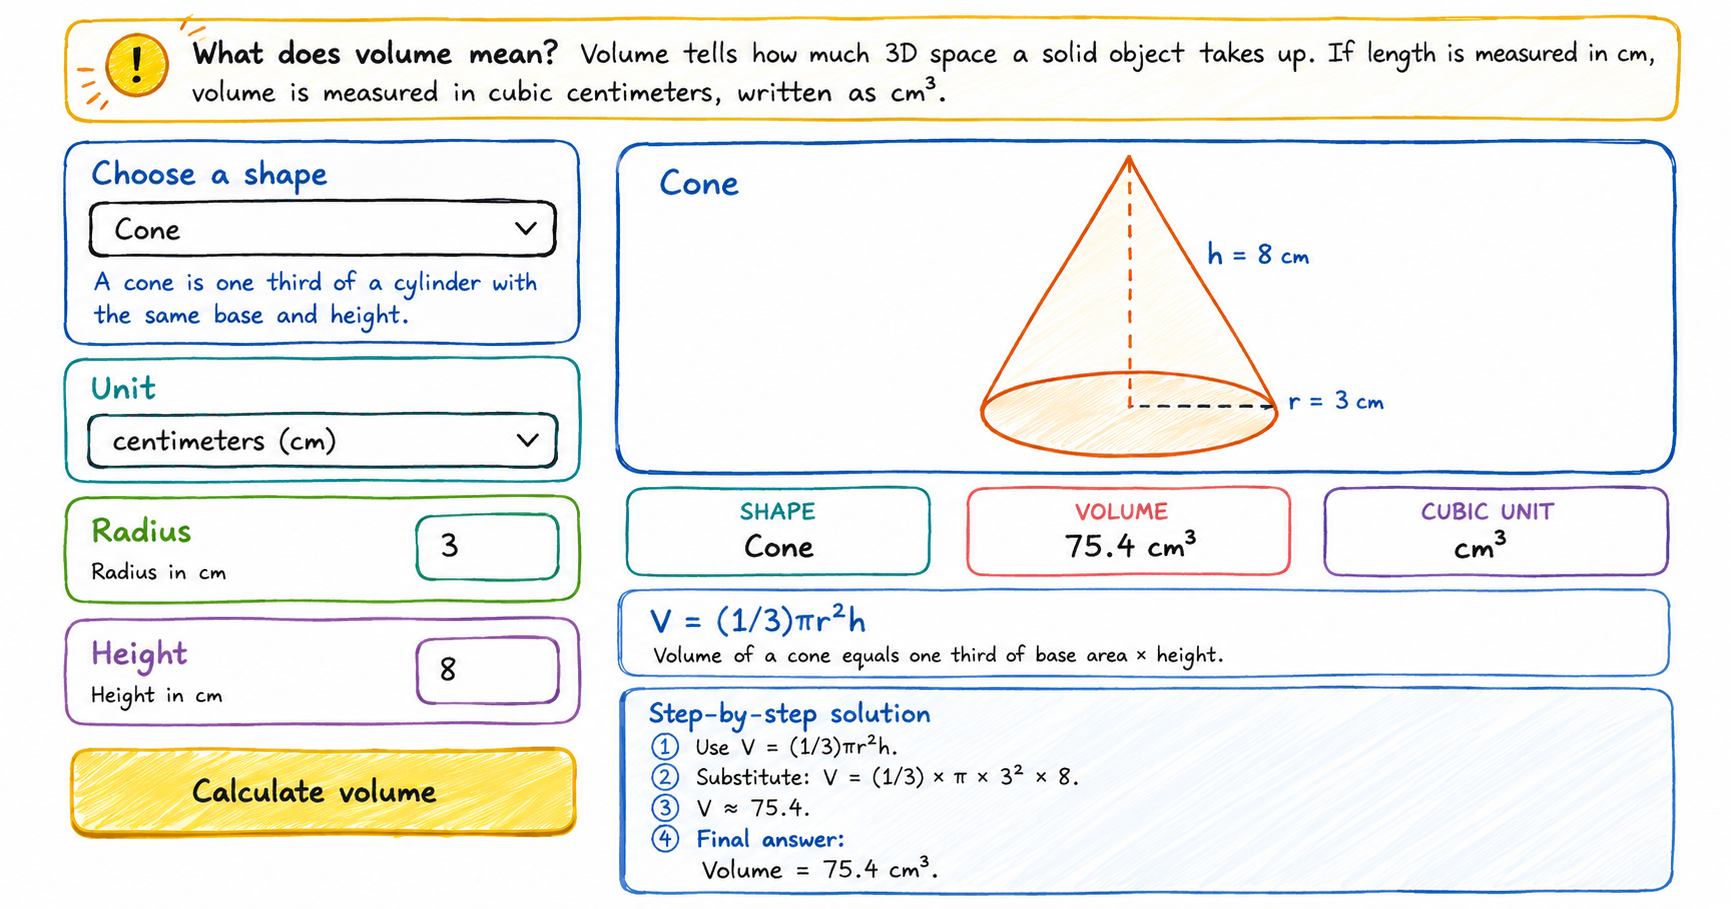
Multi-shape volume calculator showing shape selector formula diagram and cubic unit result

Use this multi-shape volume calculator to find the volume of a cube, cuboid, cylinder, cone, sphere, or hemisphere. Each answer includes a diagram, formula, cubic units, and step-by-step calculation. How to use the volume calculator 1 Choose a shape Select cube, cuboid, cylinder, cone, sphere, or hemisphere. 2 Enter measurements The input fields change automatically … Read more

Spherical Coordinates Interactive Tool

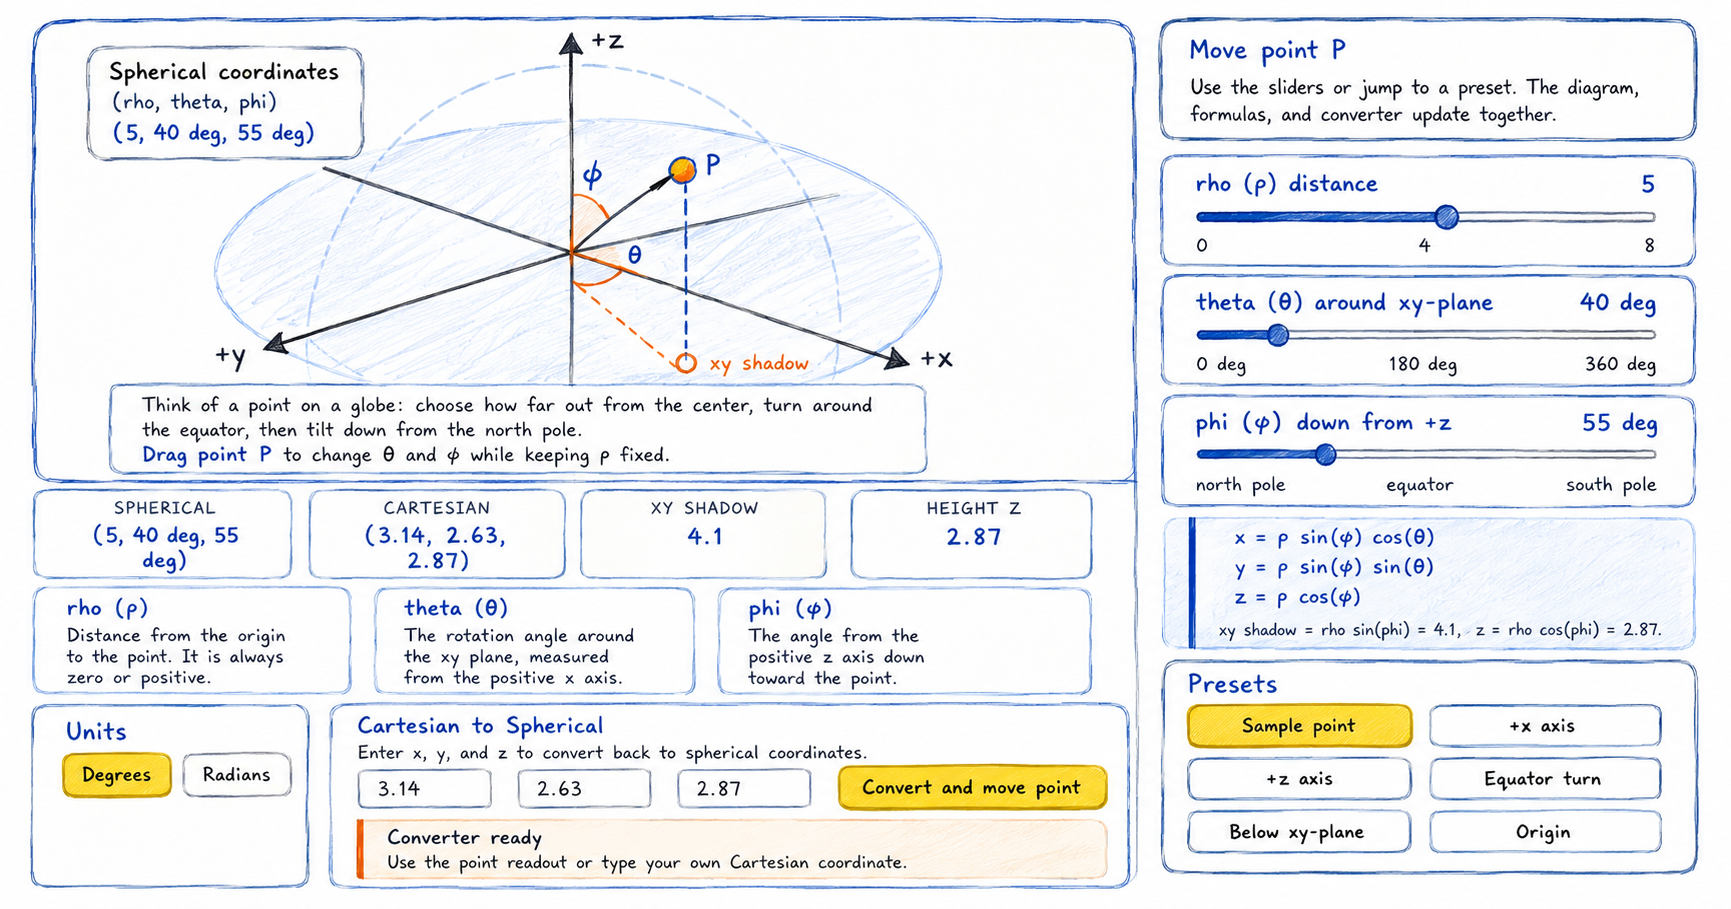
Hand-drawn scribble-style feature image of a spherical coordinates explorer showing a 3D coordinate diagram with point P, rho distance, theta angle, phi angle, and xy shadow. The interface includes sliders for rho, theta, and phi, Cartesian conversion formulas, coordinate result cards, unit options, and preset buttons for moving the point.

Explore spherical coordinates with an interactive 3D-style diagram. Drag point P, compare spherical and Cartesian coordinates, and learn how rho (ρ), theta (θ), and phi (φ) describe a point in space. How to use the spherical coordinates interactive tool This activity extends the idea of polar coordinates into 3D space. Instead of only radius and … Read more

Polar Coordinate Interactive Tool and Converter

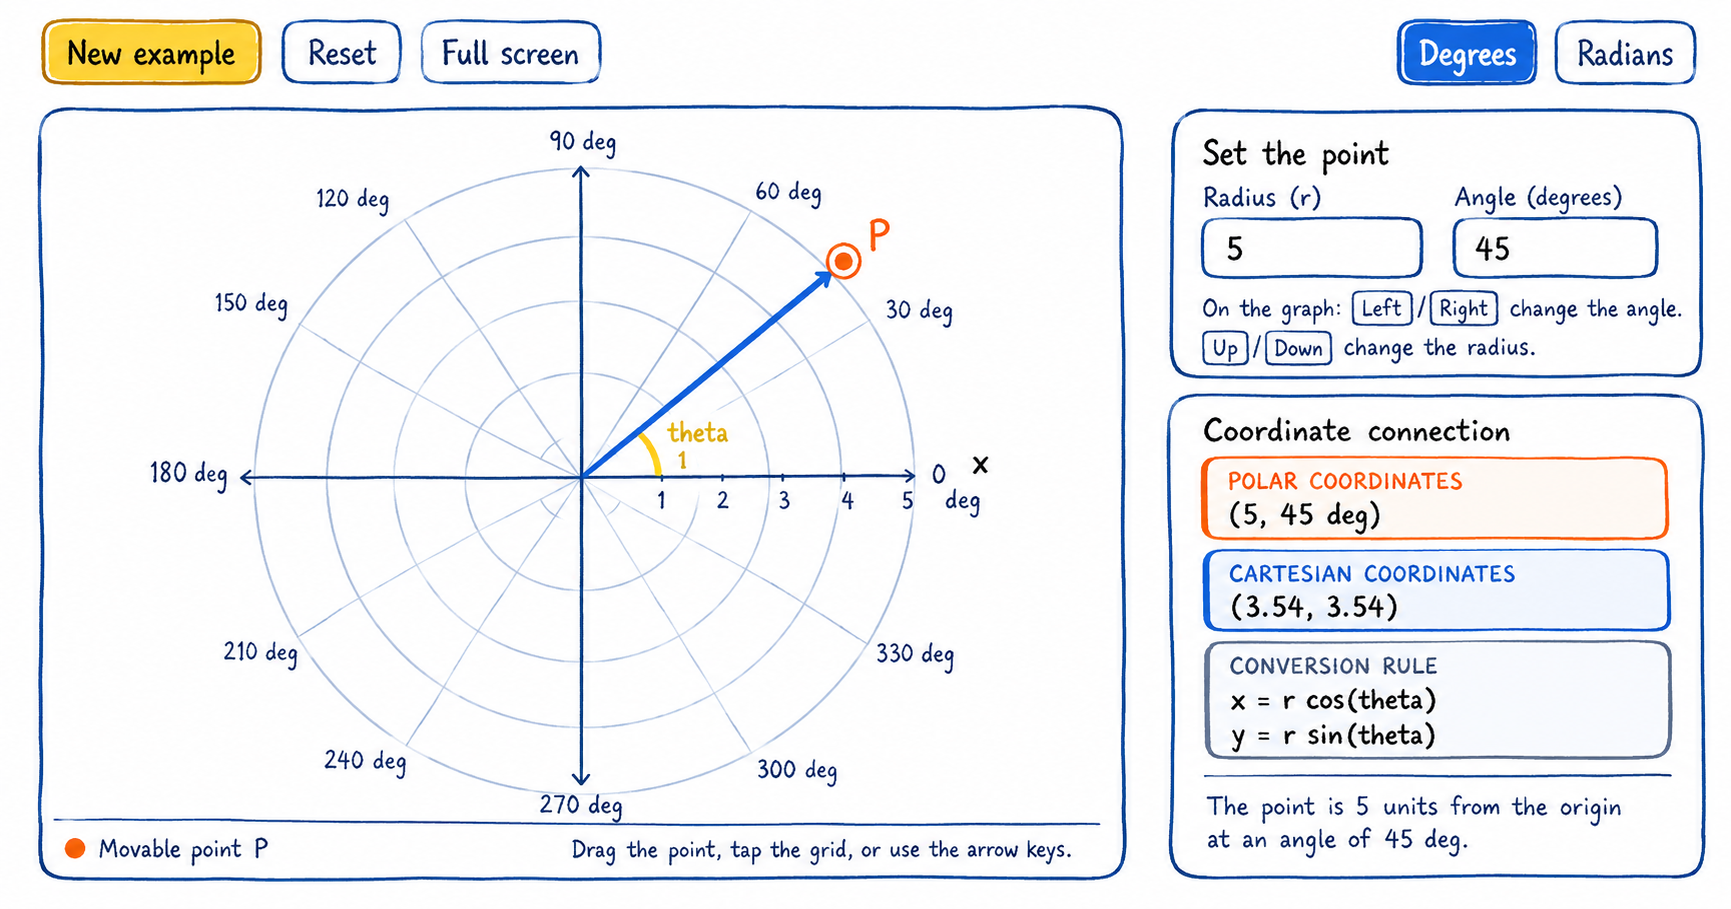
Hand-drawn scribble-style feature image of an interactive polar coordinates tool, showing a circular polar graph with a blue radius line pointing to an orange point P at 45 degrees. On the right, sketch-style panels display the radius, angle, polar coordinates, Cartesian coordinates, and conversion formulas in a clean educational layout.

Explore polar coordinates by moving a point around a circular grid. See how radius and angle describe its position, connect polar coordinates to x- and y-coordinates, and practice conversions with worked steps. How to use the polar coordinate interactive tool The activity combines a movable point with a coordinate converter. Start on the graph, then … Read more

Interactive Cartesian Coordinate Plane

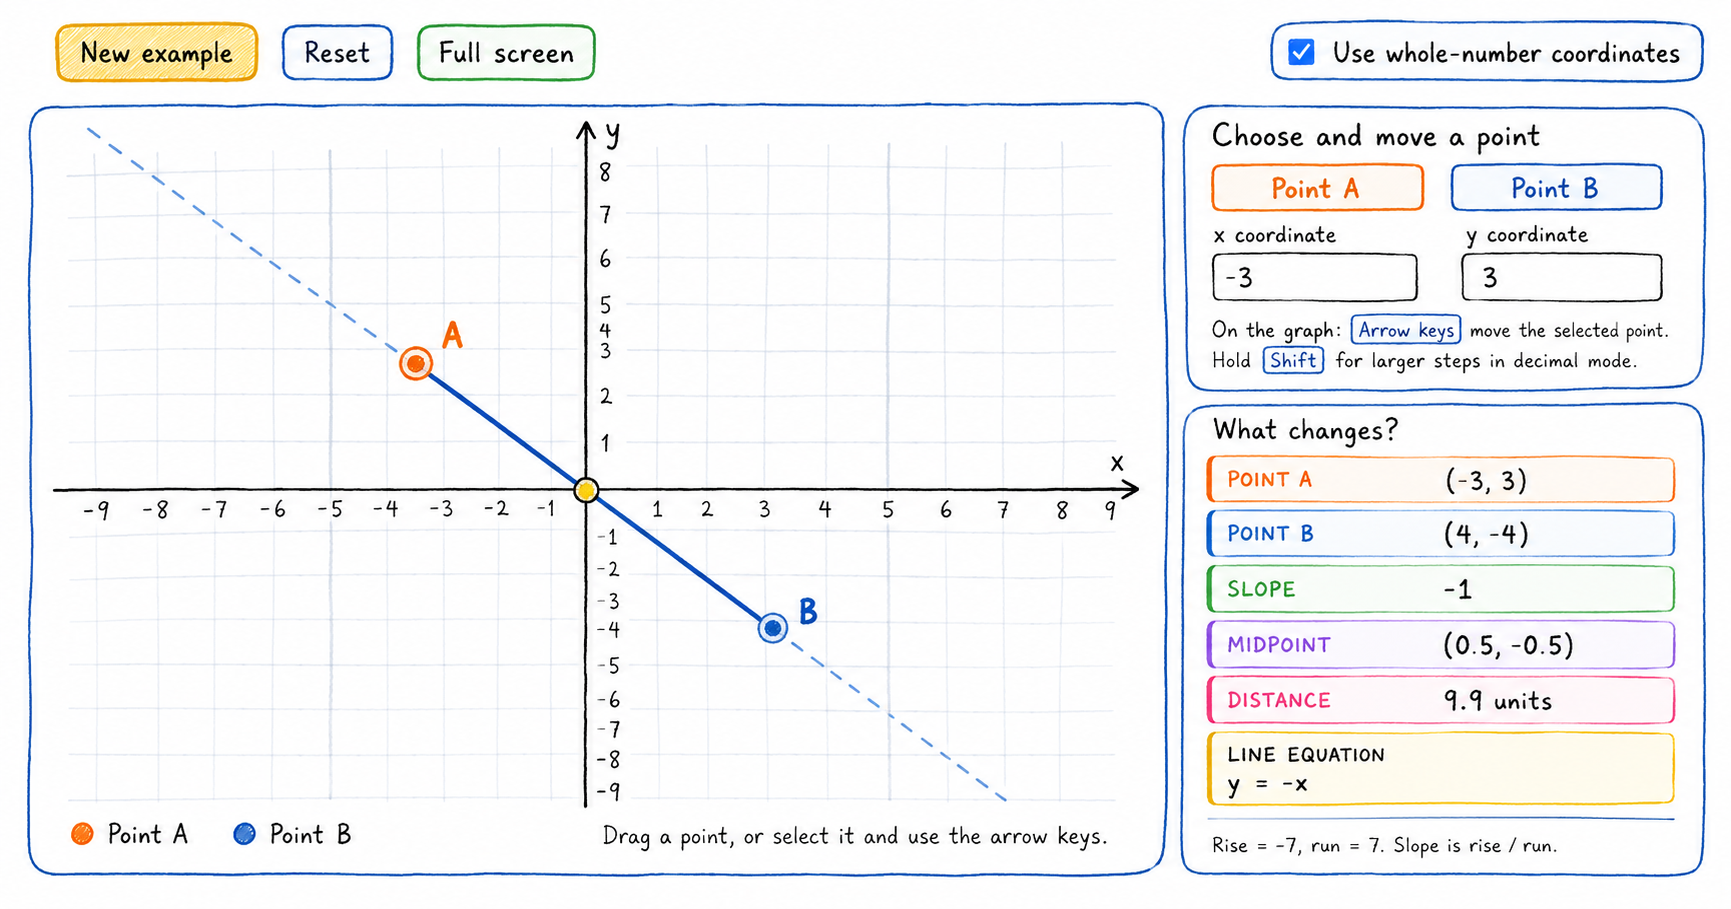
Interactive Cartesian coordinate plane showing points A and B with slope, midpoint, distance, and line equation results.

Explore the Cartesian coordinate plane by moving two points on the graph. The interactive tool calculates the slope, midpoint, distance, and equation of the line in real time, helping learners connect each formula to a visual result. How to use the Cartesian coordinate tool Start with points A and B on the coordinate plane. Every … Read more

Triangle Calculator

Hand-drawn scribble-style feature image of an interactive triangle calculator showing input panels for Pair A, Pair B, and Pair C with side and angle values. The solved triangle diagram displays labeled sides and angles, while result cards show the triangle’s missing measurements, perimeter, area, angle check, and triangle type.

Use this interactive triangle calculator to enter three known measurements, solve the missing sides and angles, view a proportional diagram, and follow the calculation method. How to use the triangle calculator Enter exactly three known measurements and leave the other three boxes empty. At least one known measurement must be a side. 1 Match opposite … Read more

Interactive Math Functions Tool (Learn Linear ,Exponential, Logarithmic and Quadratic Equations)

Hand-drawn scribble-style feature image of a Math functions interactive tool showing exponential function having the equation y = e^(0.5x), adjustable sliders for multiplier, growth rate, vertical shift, and x-value, plus a green exponential growth curve on a coordinate graph. Result boxes display the y-intercept, horizontal asymptote, and growth behavior.

Use this interactive math functions graph tool to explore linear, quadratic, exponential, and logarithmic functions by changing coefficients and observing each graph. How to use the interactive math functions graph tool Select a function family, adjust its coefficients, and compare the equation with the graph and calculated features. 1 Choose a function Select Linear, Quadratic, … Read more

What are Euclid Theorems? Explore with this Interactive Widget

An illustrated parchment scroll displaying glowing Euclidean geometry diagrams, including a triangle with labeled angles, parallel lines, and a circle theorem, surrounded by a classical compass, ruler, quill, and ink pot, illuminated by warm golden light against a teal background.

Explore Euclid’s theorems with interactive diagrams. Drag points, change measurements, and observe which geometric relationships remain true. How to use the Euclid’s theorems explorer 1 Choose a theorem Open the theorem menu and select a result from Book I or Book III of Euclid’s Elements. 2 Move the points Drag the colored points on the … Read more

How Many Ways Can You Arrange Books? A Fun Look at Factorial!

How many different ways can books be placed on a shelf? Explore factorials visually by changing the number of books, following the multiplication pattern, and browsing every possible arrangement. How to use the factorial book arranger Choose between one and six books. The activity calculates the factorial and displays the unique shelf orders in manageable … Read more

Exploring Permutations and Combinations: A Simple Visual Guide for Students

This permutations versus combinations interactive tool helps students count selections, arrangements, and possibilities. Explore exactly how the answer changes when order matters or does not matter. How to use the permutations versus combinations interactive tool Choose the total number of objects, choose how many will be picked, then compare the two counting methods. 1 Choose … Read more