Spherical Coordinates Interactive Tool

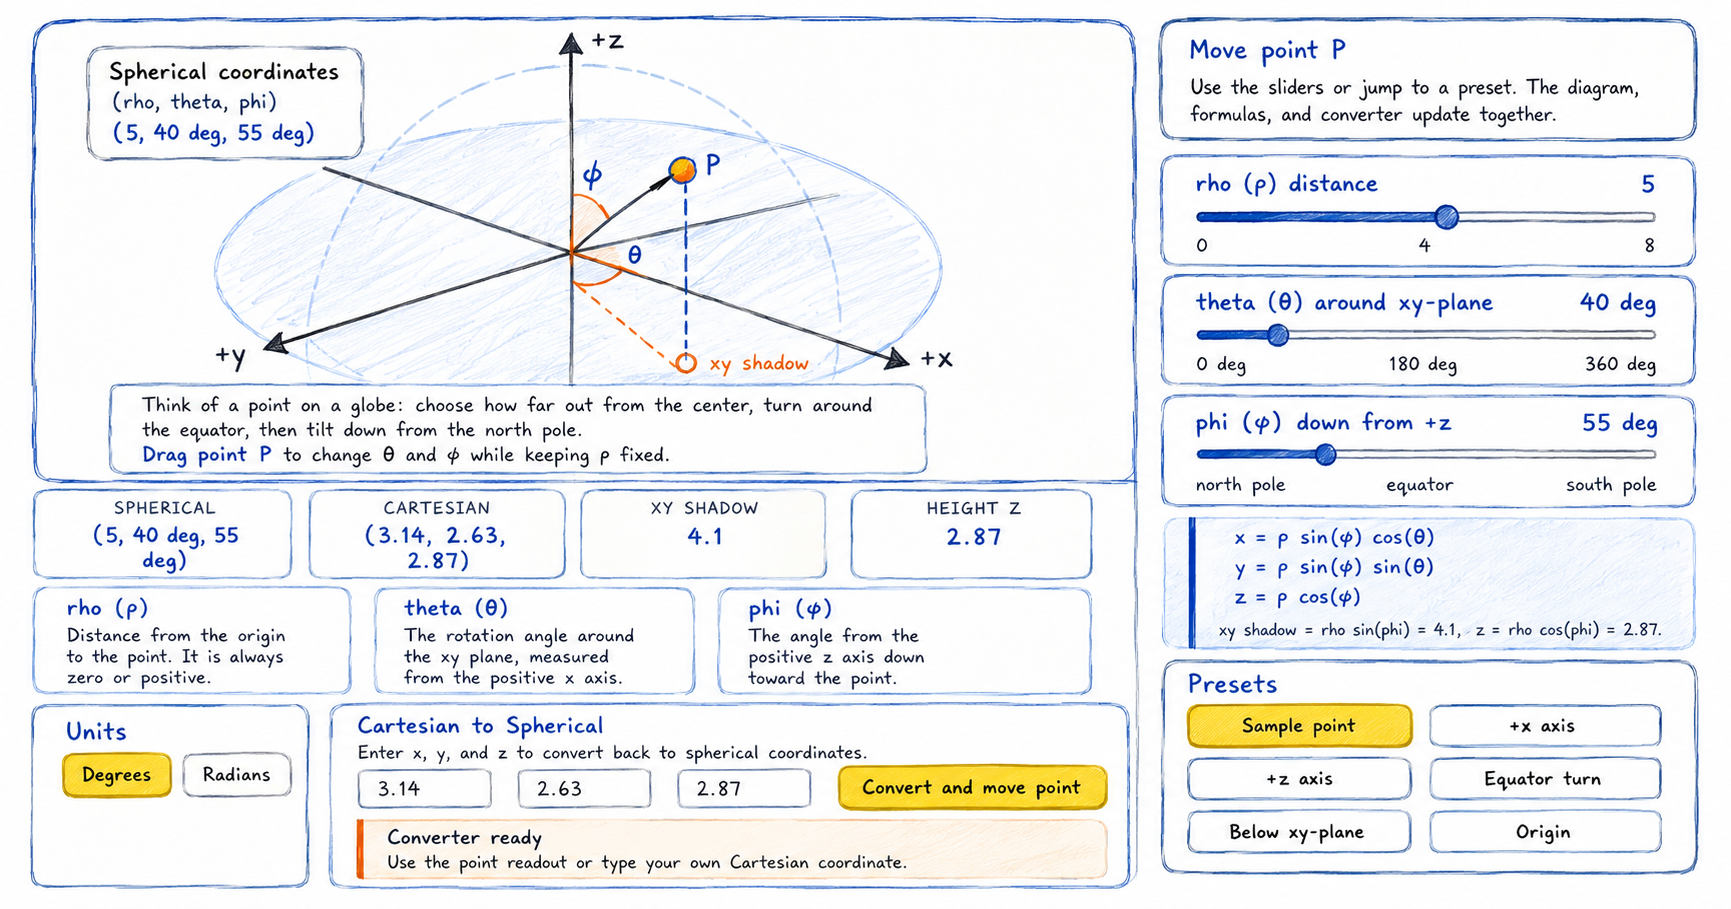
Hand-drawn scribble-style feature image of a spherical coordinates explorer showing a 3D coordinate diagram with point P, rho distance, theta angle, phi angle, and xy shadow. The interface includes sliders for rho, theta, and phi, Cartesian conversion formulas, coordinate result cards, unit options, and preset buttons for moving the point.

Explore spherical coordinates with an interactive 3D-style diagram. Drag point P, compare spherical and Cartesian coordinates, and learn how rho (ρ), theta (θ), and phi (φ) describe a point in space. How to use the spherical coordinates interactive tool This activity extends the idea of polar coordinates into 3D space. Instead of only radius and … Read more

Thermal Expansion Visualizer

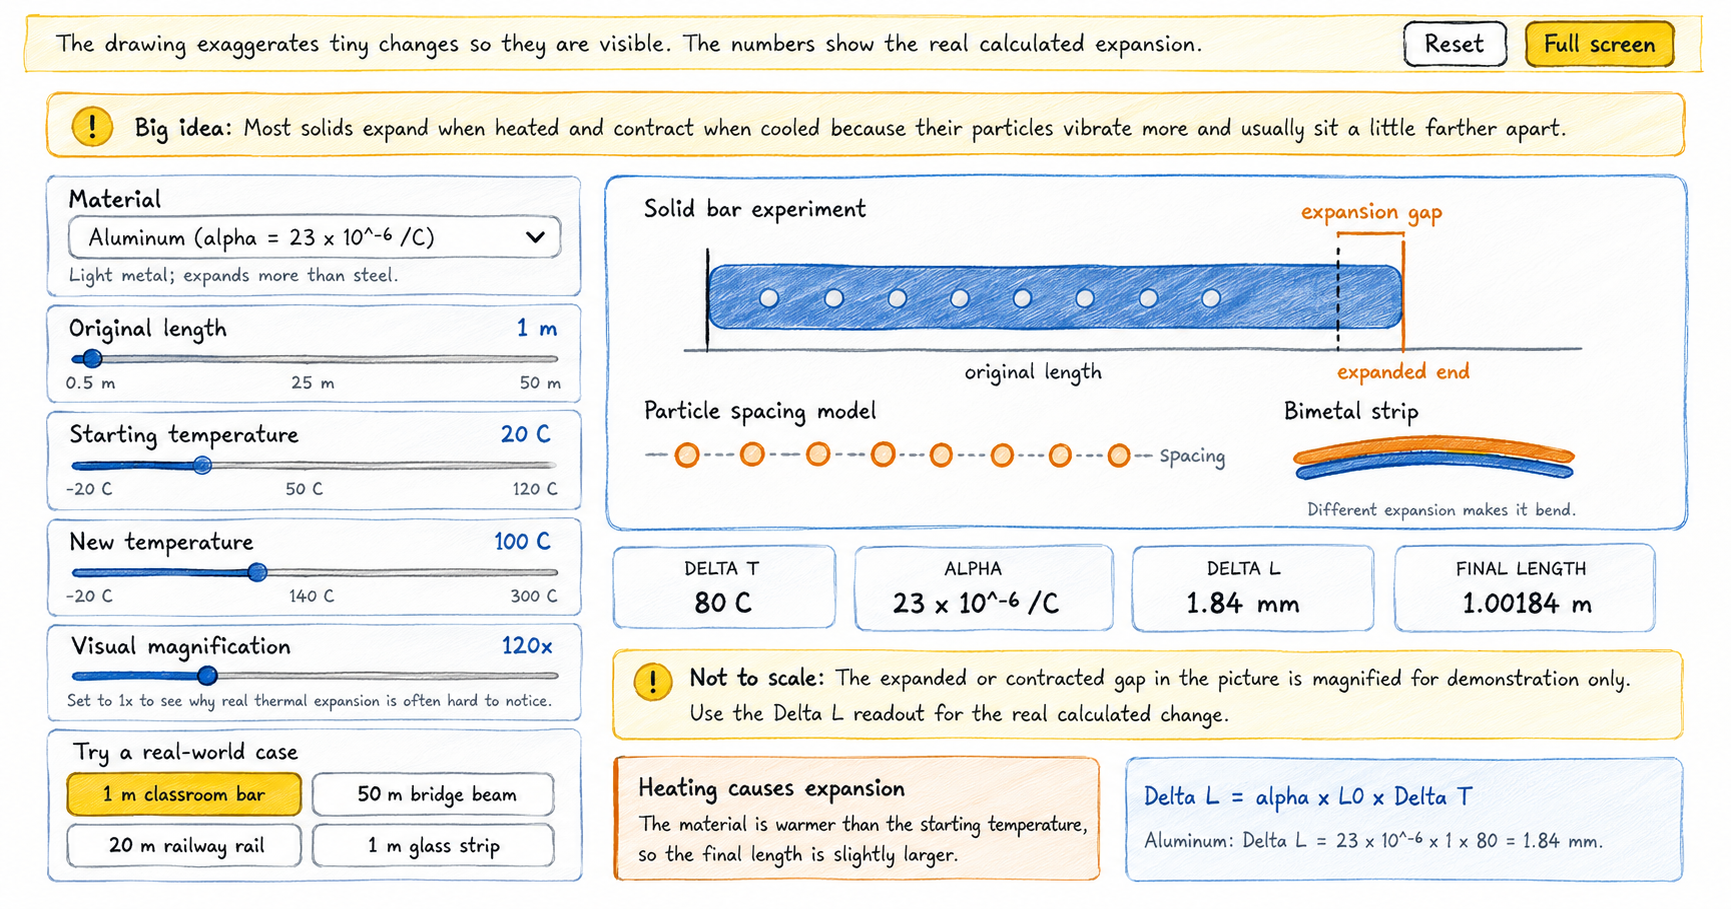
Hand-drawn scribble-style feature image of a thermal expansion simulator showing how an aluminum bar expands when heated. The interface includes sliders for material, original length, starting temperature, new temperature, and magnification, plus diagrams of an expansion gap, particle spacing model, bimetal strip, and calculated values for temperature change, length change, and final length.

Use this thermal expansion visualizer to heat and cool different materials, compare real length changes, and discover why small expansions matter in bridges, rails, glass, and metal strips. How to use the thermal expansion visualizer 1 Choose a material Pick aluminum, brass, copper, steel, glass, concrete, or invar. Each one has a different expansion coefficient. … Read more

Daily Calories Estimator

Use this daily calories estimator to learn how much energy you need daily. Young learners can compare broad kcal ranges and adult EER calculations while exploring how activity level and body measurements affect an estimate. How to use the daily calories estimator 1 Choose a mode Use basic learner mode for broad age-group ranges or … Read more

Equations of Motion Calculator

Hand-drawn scribble-style feature image of a physics motion calculator showing input boxes for initial velocity, acceleration, time, final velocity, and displacement. The interface includes a velocity-time graph, position markers at equal time intervals, calculated results, and a success message for a valid motion solution.

Use this equations of motion calculator to find missing velocity, acceleration, time, or displacement values for straight-line motion with constant acceleration. How to use the equations of motion calculator 1 Choose a positive direction Decide which direction is positive. Enter velocity, acceleration, and displacement in the opposite direction as negative values. 2 Enter three values … Read more

Polar Coordinate Interactive Tool and Converter

Hand-drawn scribble-style feature image of an interactive polar coordinates tool, showing a circular polar graph with a blue radius line pointing to an orange point P at 45 degrees. On the right, sketch-style panels display the radius, angle, polar coordinates, Cartesian coordinates, and conversion formulas in a clean educational layout.

Explore polar coordinates by moving a point around a circular grid. See how radius and angle describe its position, connect polar coordinates to x- and y-coordinates, and practice conversions with worked steps. How to use the polar coordinate interactive tool The activity combines a movable point with a coordinate converter. Start on the graph, then … Read more

Echo Simulator – Interactive Tool

Interactive echo simulator showing a sound wave travelling to a wall and returning

Use this interactive echo simulator to change the distance to a wall, air temperature, and reflecting surface, then observe the outgoing sound and its returning reflection. How to use the echo simulator 1 Choose the distance Move the distance slider to place the reflecting wall from 1 to 100 metres away. 2 Set the air … Read more

Interactive Cartesian Coordinate Plane

Interactive Cartesian coordinate plane showing points A and B with slope, midpoint, distance, and line equation results.

Explore the Cartesian coordinate plane by moving two points on the graph. The interactive tool calculates the slope, midpoint, distance, and equation of the line in real time, helping learners connect each formula to a visual result. How to use the Cartesian coordinate tool Start with points A and B on the coordinate plane. Every … Read more

Standing Wave Visualizer

Hand-drawn scribble-style feature image of an interactive standing wave simulator showing a string fixed at both ends with blue wave curves, red nodes, and yellow antinodes. The interface includes harmonic controls, frequency and wave height sliders, result cards for nodes, antinodes, fundamental frequency, and sounding tone, plus a quick observation panel explaining the 3rd harmonic.

Use this standing wave visualizer to select harmonics, adjust the wave, identify nodes and antinodes, and hear the corresponding tone. How to use the standing wave visualizer 1 Choose a harmonic Select a button from 1 through 6. The string pattern and the node, antinode, and tone readouts update immediately. 2 Adjust the controls Change … Read more

Triangle Calculator

Hand-drawn scribble-style feature image of an interactive triangle calculator showing input panels for Pair A, Pair B, and Pair C with side and angle values. The solved triangle diagram displays labeled sides and angles, while result cards show the triangle’s missing measurements, perimeter, area, angle check, and triangle type.

Use this interactive triangle calculator to enter three known measurements, solve the missing sides and angles, view a proportional diagram, and follow the calculation method. How to use the triangle calculator Enter exactly three known measurements and leave the other three boxes empty. At least one known measurement must be a side. 1 Match opposite … Read more

Interactive Math Functions Tool (Learn Linear ,Exponential, Logarithmic and Quadratic Equations)

Hand-drawn scribble-style feature image of a Math functions interactive tool showing exponential function having the equation y = e^(0.5x), adjustable sliders for multiplier, growth rate, vertical shift, and x-value, plus a green exponential growth curve on a coordinate graph. Result boxes display the y-intercept, horizontal asymptote, and growth behavior.

Use this interactive math functions graph tool to explore linear, quadratic, exponential, and logarithmic functions by changing coefficients and observing each graph. How to use the interactive math functions graph tool Select a function family, adjust its coefficients, and compare the equation with the graph and calculated features. 1 Choose a function Select Linear, Quadratic, … Read more